

Expected goals revolutionised football analysis and, with it, the approach serious bettors take to identifying value. What began as a niche statistical concept discussed in academic papers and specialist forums has become mainstream, appearing on television broadcasts and bookmaker websites worldwide. Yet for all its visibility, xG remains misunderstood by most punters who either dismiss it entirely or apply it incorrectly. This guide explains what expected goals actually measures, how the metric is calculated, where its limitations lie, and crucially, how bettors can incorporate xG analysis into profitable betting strategies.
What Expected Goals Actually Measures
Expected goals quantifies shot quality by assigning each attempt on goal a probability value between 0 and 1. A shot with 0.15 xG has, based on historical data, a 15% chance of becoming a goal. A penalty typically carries approximately 0.76 xG, reflecting the roughly 76% conversion rate from the spot. A speculative effort from thirty yards might register just 0.02 xG because such attempts rarely find the net regardless of who takes them.
The fundamental insight behind xG is that not all shots are created equal. Traditional statistics treat a tap-in from two yards identically to a thirty-yard screamer simply because both count as one goal when converted. This obviously misrepresents team and player performance. A side creating three clear-cut chances but converting none played better than one converting a single long-range deflection, even if the scoreline suggests otherwise. Expected goals captures this distinction.
Aggregating xG values across a match produces team-level expected goals totals. If Liverpool create chances worth 2.3 xG while their opponent creates chances worth 0.8 xG, Liverpool produced performance worthy of roughly 2.3 goals against roughly 0.8 conceded. The actual scoreline might differ dramatically, a keeper might produce worldclass saves or a striker might miss simple chances, but the underlying quality of chances created tells us something important about the match that the result alone obscures.
This distinction between performance and results matters enormously for betting. Results carry variance that performance measures help us see through. A team that deserves to win based on performance will, over sufficient samples, regress toward results matching that performance. Bettors who spot the gap early profit from market corrections that follow.
How xG Models Are Built
Expected goals models use machine learning trained on vast historical shot databases, typically containing hundreds of thousands of attempts. Each shot includes numerous data points that influence conversion probability. The model learns which factors most strongly predict whether shots become goals, then applies those weightings to new shots as they occur.
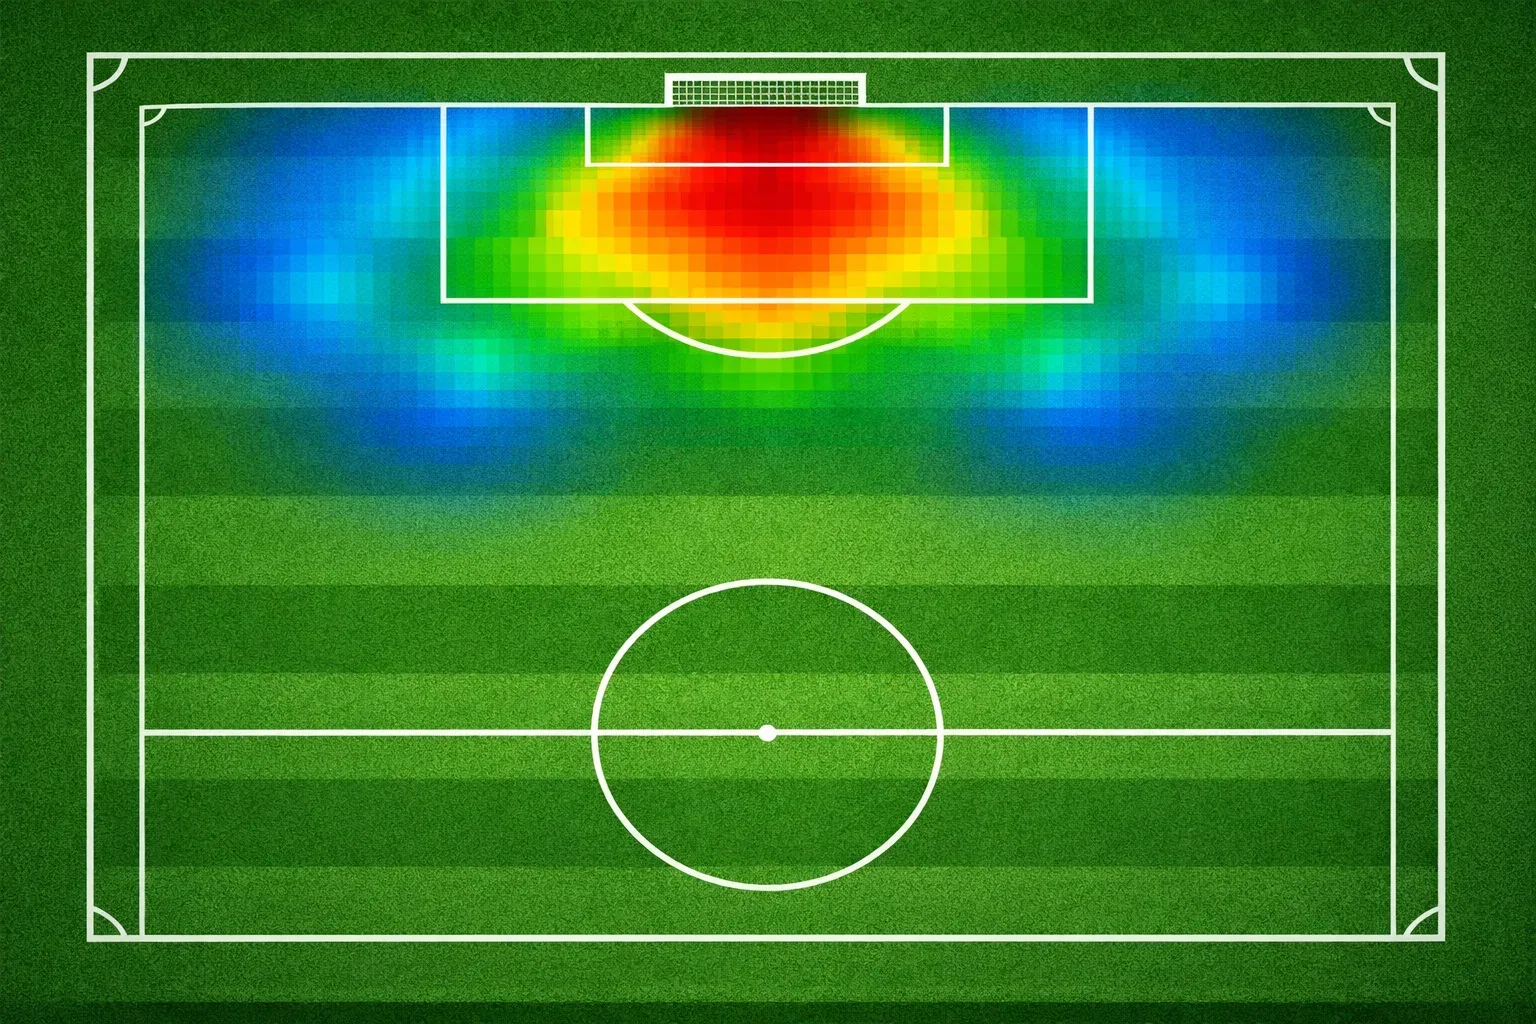
The core variables in most xG models include shot location, measured by both distance from goal and angle relative to the goalposts. Shots from central positions close to goal convert most frequently; shots from wide angles or long distances convert rarely. These spatial factors alone predict conversion rates reasonably well, which is why even basic xG models provide useful information.
Advanced models incorporate additional variables beyond location. The body part used matters because headers convert at lower rates than foot strikes. The assist type influences conversion; shots following through balls differ from shots following crosses or set pieces. Whether the shooter was under pressure from defenders, whether the goalkeeper was positioned optimally, whether the attack developed through open play or transition, all enter sophisticated models and improve predictive accuracy.
Different providers, such as Opta, StatsBomb, and Understat, build their models differently and include different variables. This produces divergent xG values for identical shots, sometimes substantially so. A shot might register 0.32 xG with one provider and 0.25 with another depending on modelling choices. Neither is objectively correct; they’re different estimates of the same underlying probability. Bettors should pick one provider and use consistently rather than cherry-picking across sources.
Why xG Matters for Betting
The primary betting application of xG involves identifying teams whose results don’t match their underlying performance. A team winning matches while generating poor xG numbers is overperforming; regression toward their true level seems likely. Conversely, a team losing despite strong xG creation is underperforming and likely to improve. Betting markets largely price based on results, creating value opportunities for those who understand the performance layer beneath.
Consider a practical example from Premier League history. Brighton under Graham Potter consistently produced attacking xG figures among the league’s best while finishing mid-table because conversion let them down repeatedly. Bettors who recognised Brighton’s underlying quality found value backing them in matches where results-based pricing undervalued their chances. Eventually, Brighton’s finishing improved (partially through recruitment, partially through regression) and results caught up with performance. Those who bet early captured value that disappeared once results reflected underlying quality.
Championship betting particularly rewards xG analysis because the market operates with less sophistication than top-flight equivalents. Bookmakers and casual bettors alike focus heavily on league position and recent results. Teams generating strong xG while suffering poor results might be priced generously for months before market correction occurs. The information gap between what results show and what performance data reveals creates exploitable inefficiency.
Over-under markets respond well to xG analysis. Teams consistently generating high combined xG (for and against) produce entertaining, high-scoring matches. Their under markets are reliably priced too short because the pattern persists. Similarly, teams with low combined xG, typically defensive sides that neither create nor concede much, offer value in under markets that results-focused pricing misses.
Adjusting xG for Defensive Teams
Standard xG models face particular challenges with extremely defensive teams. A side that deliberately suppresses shot quality against them, allowing only difficult long-range efforts, might concede xG figures that understate their defensive excellence. The model registers the shots that occur but cannot fully capture the shots that never happen because defensive structure eliminated attacking opportunities entirely.
Burnley under Sean Dyche exemplified this phenomenon. Their deep defensive block invited possession but channelled attacks into low-percentage shooting positions. xG against figures looked reasonable rather than elite, yet the team consistently outperformed their defensive xG by keeping more clean sheets than expected. Sharp analysts adjusted standard xG figures to account for this tactical approach.
The concept of “shot quality allowed” extends xG analysis for defensive teams. Rather than simply recording xG against, assess whether opponents typically generate better or worse chances against other teams. If a defensive side forces opponents to take shots of 0.08 xG average while those opponents average 0.12 xG per shot across all matches, the defensive structure is actively suppressing quality beyond what xG captures.
For betting purposes, this means applying modifiers to raw xG when evaluating certain teams. Defensive specialists might warrant a 0.7 multiplier on their xG against figures to produce realistic goal expectations. The specific modifier requires calibration based on historical clean sheet rates versus xG-implied probabilities. When a team keeps clean sheets significantly more often than their xG against suggests, defensive quality beyond the model’s capture is likely responsible.
Practical xG Data Sources
Free xG data sources exist for bettors unwilling to pay for premium services. Understat provides comprehensive xG data for major European leagues with match-level and player-level breakdowns. FBref offers expected goals alongside traditional statistics in user-friendly formats. Both update reasonably quickly after matches conclude, enabling timely analysis before subsequent betting opportunities arise.
Premium services like Opta and StatsBomb provide more granular data with additional metrics beyond basic xG. Their xG models typically incorporate more variables and update more frequently. For serious bettors placing significant stakes, the investment in premium data may be worthwhile. For recreational bettors exploring xG’s utility, free sources provide adequate starting points.
Television broadcasts increasingly display xG during matches, though relying solely on broadcast graphics limits analysis. Post-match xG totals lack the context of shot-by-shot data. Knowing a match finished 1.8 versus 0.6 xG tells you less than knowing that 1.8 comprised twelve low-quality shots versus 0.6 comprising three decent chances. The aggregate figures mask important distributional information that detailed data reveals.
Build routines around data collection. After each matchday, review xG figures for teams you’re tracking. Note patterns: which sides consistently overperform or underperform xG? Which sides’ xG has shifted recently suggesting tactical changes or personnel effects? Regular data review transforms raw numbers into betting-relevant insight through accumulated contextual knowledge.
Win backing strong defensive teams betting.
Common xG Misapplications
The most frequent xG error involves treating single-match figures as definitive. A team posting 3.2 xG in one match didn’t necessarily deserve three goals; variance in that match might have inflated chance quality through fortunate circumstances unlikely to recur. xG achieves predictive power over samples of ten-plus matches, not individual fixtures. Never base a betting decision on one match’s xG figures alone.
Another mistake is ignoring finishing quality differences. xG models assume league-average finishing ability because they cannot predict which specific player takes each shot. A side with elite finishers, think prime Suarez at Liverpool or Aguero at City, will sustainably convert above xG expectation because their individuals genuinely outperform average. xG comparison must acknowledge these finishing talent differentials where they exist.

Overweighting xG while ignoring match context undermines analysis. A team losing 2-0 and desperately attacking in final minutes might post strong xG figures despite the match being effectively over. The chances created in desperation tell us less about underlying quality than chances created when the match was competitive. Context-blind xG aggregation treats all chances equivalently when it shouldn’t.
Finally, treating xG as predictive certainty rather than probability distribution causes problems. A team with 1.5 xG expectation doesn’t “expect” 1.5 goals; they expect somewhere between zero and three goals with probability peaks around one and two. The point estimate is useful but represents a distribution’s centre, not a prediction’s precision. Respect uncertainty in your betting approach.
Integrating xG Into Betting Strategy
Start with comparative analysis. Before backing a team, check their xG creation and concession over recent matches. Compare those figures to their actual goals scored and conceded. If significant gaps exist, consider whether you’re betting into or against likely regression. Backing a team whose recent losses mask strong underlying performance differs from backing one whose wins rely on unsustainable overperformance.
Combine xG with other factors rather than treating it as sole determinant. Team news, tactical matchups, fixture timing, and motivational factors all influence outcomes independently of xG-captured performance quality. The bettor who synthesises xG with broader context makes better decisions than one who relies on any single information source exclusively.
Use xG to validate or challenge your intuitions. When your qualitative assessment of a match differs from xG-implied expectations, investigate why. Perhaps you’re seeing something the model misses, perhaps the model captures something your eye doesn’t. Either way, the discrepancy deserves investigation before betting. Agreement between qualitative and quantitative analysis increases confidence; disagreement demands further thought.
Track your xG-informed bets separately from other bets. Review whether incorporating xG genuinely improves your betting outcomes over time. If your xG-informed selections outperform your intuition-only selections, lean further into the data. If not, refine how you’re applying xG or acknowledge limitations in your analysis process. Empirical review of your own betting performance matters more than theoretical commitment to any methodology.
The Future of xG in Betting
Expected goals continues evolving as data collection improves and models incorporate additional variables. Post-shot xG, which accounts for shot placement as well as shot location, provides more accurate assessments of chance quality than standard pre-shot xG. Expected threat and possession value models extend beyond shots to assess chance-building quality throughout possessions. These developments offer bettors increasingly sophisticated tools for performance assessment.
Bookmakers themselves increasingly incorporate xG into their pricing models, which gradually erodes the information advantage early xG adopters enjoyed. The market becomes more efficient as more participants price based on performance data. Value opportunities shift toward areas where xG application remains less sophisticated or where additional contextual factors create gaps between model prices and true probabilities.
For Championship betting specifically, xG application likely remains underutilised compared to top-flight markets. Lower media coverage means less public awareness of performance-result discrepancies. Bookmaker pricing resources concentrate on higher-turnover markets, leaving second-tier pricing vulnerable to sophisticated analysis. The Championship offers fertile ground for xG-informed betting even as Premier League edges narrow.
Expected goals transformed football analysis and continues transforming football betting. Those who understand what xG measures, apply it appropriately with recognition of its limitations, and integrate it with broader analysis rather than treating it as magic answer will extract value from markets still learning to price performance rather than just results.
Trust the professional experts behind burnley bet.