

The Poisson distribution has become the foundation of quantitative football betting since statisticians recognised that goal-scoring follows predictable mathematical patterns. Named after French mathematician Simeon Denis Poisson, this probability distribution models the likelihood of discrete events occurring within fixed intervals, precisely the challenge football bettors face when predicting how many goals each team might score. This guide explains the mathematics behind Poisson-based predictions, walks through practical implementation, addresses the model’s limitations, and shows how modifications can improve accuracy for betting on defensive teams.
The Mathematical Foundation
Poisson distribution calculates the probability of a given number of events occurring when you know the average rate at which those events happen. In football terms, if a team averages 1.5 goals per match, Poisson tells us the probability they’ll score exactly 0, 1, 2, 3, or more goals in any given game. The formula assigns decreasing probabilities to outcomes further from the average while acknowledging that both high and low extremes remain possible.
The mathematical formula involves exponential terms that most bettors need not calculate manually. Excel’s POISSON.DIST function and numerous online calculators handle the computation. What matters conceptually is understanding that Poisson treats goals as independent events occurring randomly at a constant rate. Given an expected goal rate, the distribution provides probabilities for each possible goal total. These probabilities must sum to 100% across all outcomes, creating a complete probability landscape for team-level scoring.
Converting team goal probabilities into match outcome predictions requires combining two separate Poisson distributions, one for each team. If the home side has expected goals of 1.8 and the away side 1.0, you calculate both distributions independently then multiply probabilities to find likelihood of each scoreline. The probability of 2-0 equals the probability of the home team scoring exactly 2 (from their 1.8 average) multiplied by the probability of the away team scoring exactly 0 (from their 1.0 average).
This grid of scoreline probabilities then aggregates into market-relevant outcomes. Sum all probabilities where home goals exceed away goals to find home win probability. Sum all probabilities where goals are equal for draw probability. Sum remaining probabilities for away win probability. The same grid provides over/under probabilities by summing scorelines with total goals above or below the relevant threshold.
Calculating Expected Goals Per Team
Poisson predictions require expected goal inputs for each team, which must come from analysis external to the model itself. The simplest approach uses each team’s average goals scored and conceded across recent matches, adjusted for home and away venue. More sophisticated approaches incorporate opponent quality, weighting goals against strong defences more heavily than goals against weak ones.
A common method calculates attacking and defensive strength relative to league averages. If the league averages 1.4 goals per home team and 1.0 per away team, a home side averaging 1.7 goals scored has attacking strength of 1.7/1.4 = 1.21. If the visiting side averages 1.3 goals conceded away, their defensive weakness equals 1.3/1.0 = 1.30. Multiply home attacking strength by away defensive weakness and league average: 1.21 × 1.30 × 1.4 = 2.2 expected home goals.
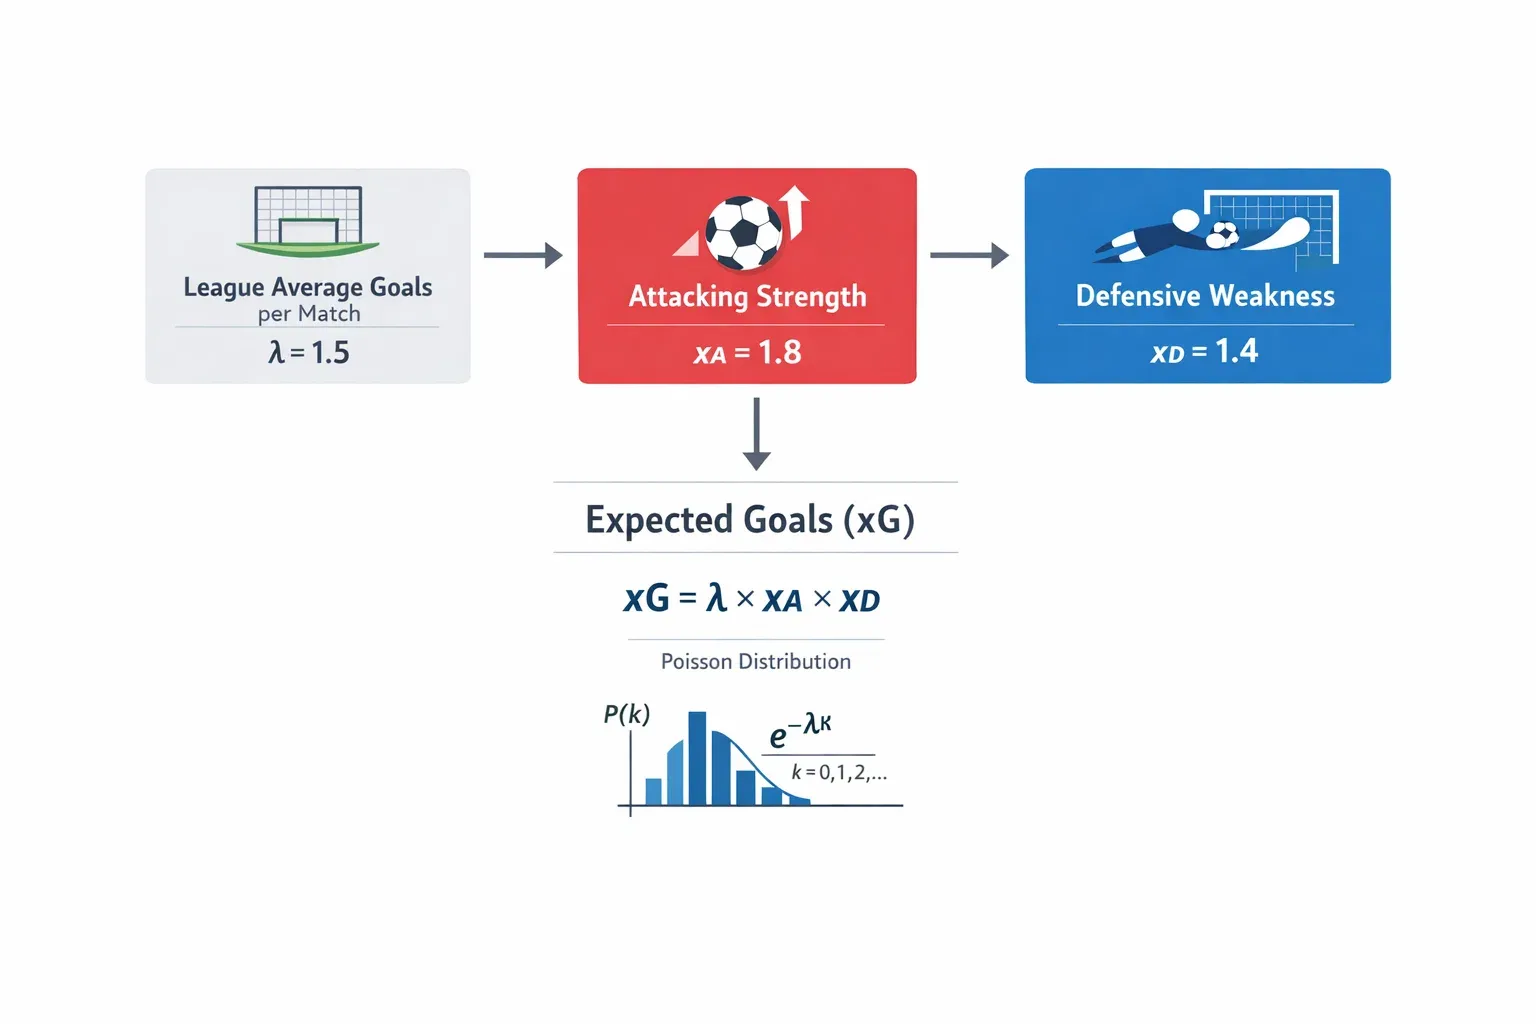
The same calculation applies in reverse for expected away goals. Calculate the away team’s attacking strength, the home team’s defensive strength, multiply by league average away goals, and you have expected away team scoring. With expected goals for both teams, Poisson distribution generates scoreline probabilities that feed every betting market you might consider.
Data selection influences predictions significantly. Using full-season data provides larger samples but may reflect outdated team states. Using recent matches (last five or ten) captures current form but produces volatile estimates vulnerable to small-sample distortions. Many successful modelers blend time periods, perhaps weighting recent matches at 60% and full-season at 40%, balancing recency and stability.
From Probabilities to Betting Decisions
Raw Poisson probabilities become actionable when converted to implied odds for comparison against bookmaker prices. If your model assigns 45% probability to a home win, the fair odds are 1/0.45 = 2.22. When a bookmaker offers 2.50 for the same outcome, value exists because the market price implies only 40% probability while your model estimates 45%. Conversely, odds of 2.00 implying 50% probability represent poor value against your 45% estimate.
Systematic value betting involves calculating fair odds for all outcomes, comparing against multiple bookmakers, and betting wherever your edge exceeds transaction costs. A 3% edge covers typical bet-to-profit margins and produces long-term profitability. Smaller edges might not survive variance and opportunity costs; larger edges occur less frequently but generate higher expected returns per bet.
Correct score markets offer perhaps the purest Poisson application. Each scoreline receives an explicit probability from your model; each scoreline carries explicit odds from bookmakers. The comparison is direct and mathematical. Portfolios of correct score bets based on Poisson probabilities can outperform single-outcome betting by diversifying variance while capturing aggregate edge across multiple selections.
Over-under markets suit Poisson analysis particularly well because you’re directly estimating total goal probability. Sum Poisson probabilities for scorelines producing 0-2 total goals for under 2.5 probability; the remainder gives over 2.5. Compare against market odds to identify value. The calculation is straightforward and the market is liquid, making this a popular starting point for Poisson-informed betting.
Model Limitations and Adjustments
Poisson distribution assumes goals are independent events occurring at constant rates, assumptions that don’t perfectly hold in football. Goals in real matches are not entirely independent; scoring changes game dynamics, potentially causing teams to change approach in ways that affect subsequent goal probability. A team leading 2-0 might defend more conservatively, reducing both their own and opponent’s scoring rates. Poisson cannot capture these dynamic shifts.
The distribution also tends to underestimate 0-0 results. Empirical studies show scoreless draws occur more frequently than basic Poisson models predict, likely because some matches genuinely produce few chances through mutual defensive effectiveness rather than random goal absence. “Zero-inflation” adjustments boost 0-0 probability by a small percentage (typically 1-3%) to align model predictions with historical occurrence rates.
High-scoring matches face opposite distortion. Poisson may underweight very high scorelines because its assumptions about rate constancy don’t account for matches that “open up” after early goals. Once defensive structures collapse, goals come in bunches that exceed what constant-rate models anticipate. Some modelers cap Poisson estimates for scorelines above 4-2 and redistribute probability to more moderate outcomes.
Team-specific factors that Poisson ignores include playing styles, tactical matchups, and in-game management tendencies. A possession-dominant side facing a counter-attacking opponent produces different dynamics than Poisson’s assumption-free probability assignment can capture. Layering tactical analysis onto Poisson output improves predictions; treating Poisson as the complete answer guarantees inferior performance.
Modifying Poisson for Defensive Teams
Standard Poisson application struggles with defensively extreme teams whose scoring patterns deviate systematically from league averages. A side that deliberately suppresses shots against them, conceding few chances even when under pressure, will keep more clean sheets than their expected goals against implies. The model sees the chances that occur but cannot account for tactical approaches that eliminate chances entirely.
For these teams, applying a “defensive multiplier” to expected goals against improves accuracy. If a team historically concedes 20% fewer goals than their xG against predicts, multiply your Poisson expected goals against by 0.8 before calculating probability distributions. This calibration produces predictions that better match their actual goal concession patterns, improving under betting accuracy and clean sheet probability estimates.
The “bus parking coefficient” captures how defensive approaches change probability distributions beyond simple average adjustment. Very defensive teams produce bimodal outcome distributions: either they keep clean sheets and nick 1-0 wins, or they concede early and must abandon their approach, potentially conceding multiple goals. Standard Poisson produces unimodal distributions that miss this tactical reality. Adjusting for these tendencies requires departure from pure Poisson into hybrid models.
Combining Poisson with observational assessment handles cases where historical statistics mislead. If a traditionally defensive team has changed manager or tactical approach, historical data may not reflect current capability. Qualitative assessment of tactical setup should inform the expected goal inputs your Poisson model receives. The model processes inputs mathematically, but input selection requires understanding beyond what mathematics alone provides.
Practical Implementation Steps
Building your own Poisson model requires spreadsheet competence and disciplined data collection. Start by downloading historical results from Football-Data.co.uk or similar sources. Calculate league averages for home and away goals. Compute attacking and defensive strength ratings for each team based on goals scored and conceded relative to those averages.
Create a prediction interface where you input home and away team identifiers. Use lookup functions to retrieve their attacking and defensive strengths. Calculate expected goals for each team in the specific fixture. Apply POISSON.DIST formulas across a scoreline grid (0-0 through 5-5 typically captures 99%+ of outcomes). Sum grid regions to produce match outcome, over/under, and BTTS probabilities.

Backtest your model by predicting past matches and comparing results to historical outcomes. Did your model’s home win probability align with actual home win rates across samples? Did your under 2.5 predictions match empirical under 2.5 frequency? Calibration issues become apparent through backtesting; adjust calculations if systematic biases emerge.
Track live predictions for upcoming matches before results are known. Record your model’s probabilities alongside bookmaker odds. After matches conclude, calculate whether betting positive expected value according to your model would have generated profit. Only empirical validation against real betting lines demonstrates whether your Poisson implementation genuinely identifies value.
Dedicate time towards building betting model.
Combining Poisson with Other Methods
Poisson works best as one component within a broader analytical framework rather than sole prediction method. Its mathematical elegance provides rigorous probability assignment; its limitations require supplementation from other information sources. Sharp bettors use Poisson as baseline then adjust for factors the model cannot capture.
Expected goals models complement Poisson by providing performance-based expected goal inputs rather than relying on historical goals that include finishing variance. Feeding xG-derived expectations into Poisson produces predictions reflecting underlying chance creation quality rather than potentially unsustainable scoring rates. The combination captures both tactical shot quality (xG) and probability distribution (Poisson) in unified framework.
Qualitative match analysis overlays contextual factors onto Poisson outputs. Key injuries, managerial changes, fixture timing, and motivational circumstances all influence outcomes independently of what probability models predict. Adjusting Poisson probabilities by 5-10% based on contextual assessment captures information that purely quantitative approaches miss. The goal is synthesis rather than replacement of mathematical models.
Market information provides external check on your model’s assessments. If your Poisson model consistently disagrees with market consensus, investigate whether you’re seeing something others miss or whether your model contains errors. Persistent disagreement with efficient markets more likely reflects model flaws than universal market failure. Use market prices as calibration signal rather than assuming your model is automatically correct.
Realistic Expectations and Long-Term View
Poisson-based betting won’t produce instant riches. The edges identified are typically small, perhaps 2-5% on individual bets, requiring volume and patience to generate meaningful returns. Losing streaks will occur despite sound methodology; variance affects even well-calibrated models across short time horizons.
Over a full season of disciplined Poisson-informed betting, realistic return on investment ranges from 3-8% for competent modelers betting into efficient markets. Higher returns are possible in less efficient markets like lower-league football where bookmaker pricing receives less sophisticated attention. Championship betting potentially offers larger edges than Premier League equivalents for this reason.
The primary value of Poisson modeling lies in systematic discipline rather than magic prediction. Building and maintaining a model forces regular engagement with relevant data. Comparing model outputs against market prices develops intuition for value identification. The process improves betting skill even when specific predictions miss, because the analytical habit compounds over time into genuine expertise.
Poisson distribution provides mathematical foundation for football betting that casual punters lack. It doesn’t guarantee profit, but it transforms betting from guesswork into quantitative estimation. Those who master Poisson methodology and combine it wisely with contextual analysis possess tools that most market participants lack, creating the conditions under which genuine betting edge becomes achievable.
Cut awful losing streaks actively using burnley bet.