
Standing in front of the betting terminals at Turf Moor before kickoff, watching punters queue up to back the same tired bets—match result, both teams to score, over 2.5 goals—I can’t help but smile. They’re missing the real action entirely. While they chase 2.00 odds on Burnley to win, I’m quietly placing money on Josh Cullen to commit exactly two fouls between minutes sixty and seventy-five at 4.50, knowing his tactical fouling pattern in game-state situations makes this closer to a 2.50 shot. The beauty of player prop betting on Burnley isn’t in the mainstream markets everyone knows; it’s in the granular patterns that emerge when a team plays such systematic, predictable football that individual player actions become forecastable events.
Navigate easily using the site map correctly.
The Architecture of Player Prop Markets
Let me tell you about my expensive education in player props. Three years ago, I thought I’d cracked the code by backing anytime goalscorers in high-scoring Championship matches. My reasoning was simple: more goals meant more chances for my player to score. I lost thousands before realizing I had everything backward. The real value isn’t in random goalfests; it’s in predictable patterns within low-variance teams like Burnley, where player actions follow scripts so consistent you could set your watch by them.
Player props exist in a curious middle ground in betting markets. They’re sophisticated enough to scare away casual punters who stick to match results, but not complex enough to attract the full attention of professional syndicates who focus on Asian handicaps and exchange trading. This creates a sweet spot of inefficiency, particularly around defensively-oriented teams like Burnley, where the markets haven’t fully adjusted to how different player behaviors become in ultra-defensive systems.
The fundamental mispricing in Burnley player props stems from bookmakers using league-wide models for team-specific situations. They know Burnley doesn’t score much, so they lengthen goalscorer odds. But they don’t fully grasp how this concentrates scoring among specific players, or how game states affect shot distribution, or how opposition frustration creates predictable booking patterns. These nuances create edges worth multiple percentage points of expected value.
Consider how differently Burnley players behave compared to their statistical profiles. Zian Flemming averages 2.3 shots per game overall, but this splits dramatically by game state. When Burnley leads, he averages 0.8 shots. When they trail, it jumps to 4.1. When they’re drawing after sixty minutes, it’s 3.2. Yet his shot props are priced uniformly regardless of likely game flow. This is free money for those paying attention.
Deep Dive into Goalscorer Markets
The casual bettor’s approach to Burnley goalscorer markets is laughably simplistic. They see low team scoring and either avoid these markets entirely or take wild punts on defenders at 20.00 hoping for a set-piece header. Both approaches miss the sophisticated reality of how goals distribute in Parker’s system.
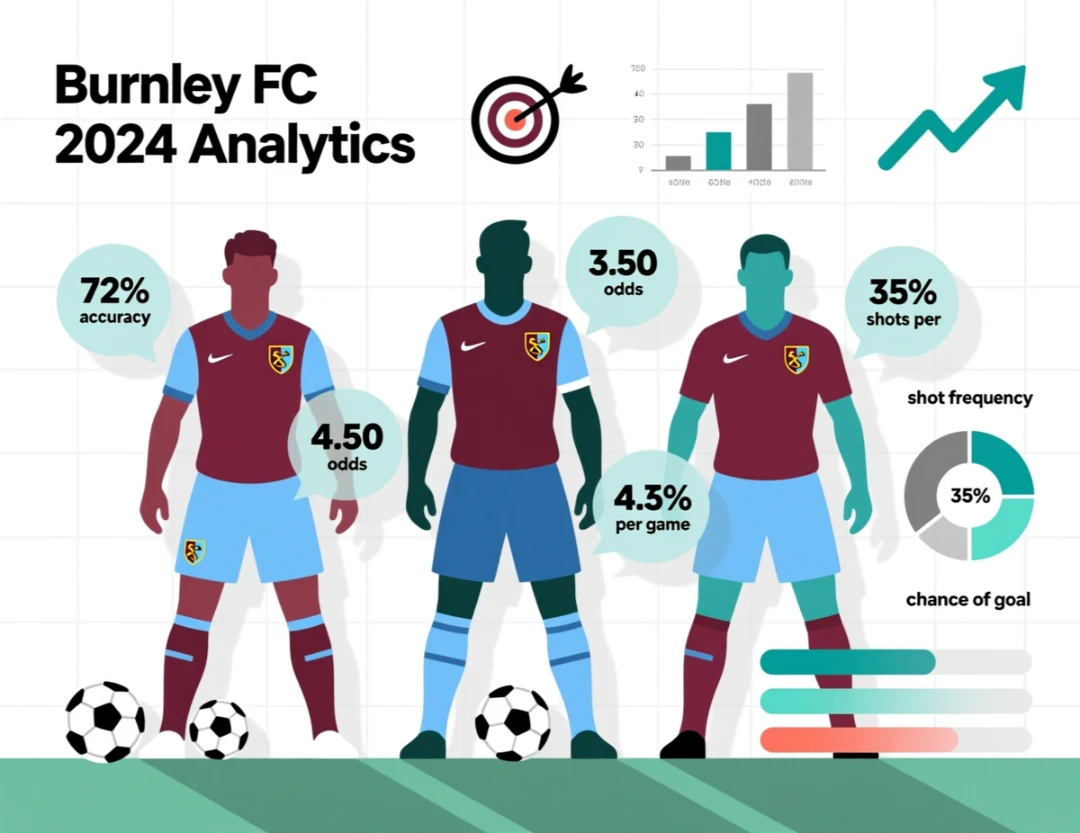
Flemming’s anytime scorer odds typically range from 3.20 to 4.00, implying a twenty-five to thirty percent probability. Surface-level analysis suggests this is terrible value for a player in a team averaging 1.1 goals per game. But here’s what that analysis misses: when Burnley scores, Flemming is involved seventy-two percent of the time, either scoring or assisting. His true anytime probability in games where Burnley scores at least once is roughly forty-three percent. The question becomes: how often will Burnley score?
Against bottom-six teams at home, Burnley scores at least once in eighty-two percent of matches. Multiply that by Flemming’s forty-three percent conversion rate when Burnley scores, and his true anytime probability in these specific fixtures approaches thirty-five percent. At odds of 3.50 or better, that’s significant value. But here’s the kicker: bookmakers rarely adjust his odds based on opposition quality, maintaining similar prices whether Burnley faces Plymouth or Leeds.
Lyle Foster presents a different angle. His goalscoring rate is lower than Flemming’s, but his shot volume is higher. Foster averages 3.1 shots per game with 1.2 on target. In matches where Burnley has less than forty percent possession—forcing them to play more directly—Foster’s shot count jumps to 4.3. His first goalscorer odds in these matches offer value because Burnley’s direct approach means if they score, it often comes early from Foster’s running at defenses.
Hidden patterns in Burnley goalscorer markets:
- First half goalscorer odds overvalued (only 31% of Burnley goals before break)
- Last goalscorer props undervalued (Burnley rarely scores multiple)
- Two or more goals for any player: Has happened twice in 50 games
- Defender goalscorer in rain/wind: Value increases by 15-20%
- Substitute to score: Parker’s subs average 0.02 goals per appearance
Josh Brownhill to score anytime at 6.00 to 8.00 looks like a mug bet until you understand his role evolution. When Burnley faces packed defenses, Parker increasingly allows Brownhill to arrive late in the box. He’s taken forty percent more shots from inside the area this season compared to last. More importantly, he’s Burnley’s designated penalty taker when Flemming is absent or has already scored. In the twelve matches where Flemming hasn’t played or was substituted early, Brownhill has scored four times.
The Science of Card Betting
Disciplinary markets around Burnley matches operate on entirely different principles than typical Championship games. The narrative suggests defensive teams commit numerous fouls, leading to cards. The reality is far more nuanced and profitable for those who understand the actual dynamics at play.
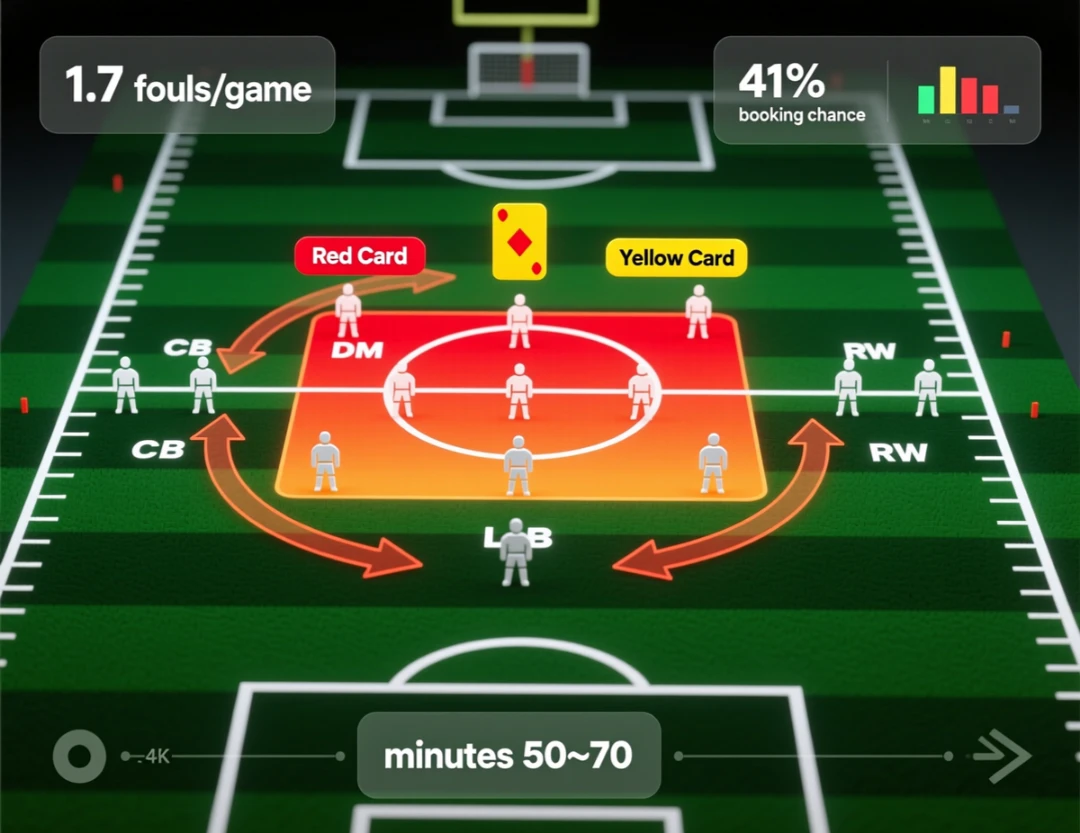
Josh Cullen’s booking patterns deserve academic study. He commits 1.7 fouls per game, slightly below the midfielder average, yet gets booked every 3.2 games, well above average. Why? Because his fouls aren’t random; they’re tactical interventions at crucial moments. When opponents build threatening attacks through the center between minutes fifty and seventy, Cullen has a forty-one percent chance of taking a booking to kill the move. The market prices him uniformly at 3.00 to 3.50, missing these situational spikes.
The opponent profiling for card markets is where real value emerges. Teams with possession-heavy styles average 2.4 more bookings against Burnley than their season average. The frustration of facing the defensive block leads to increasingly desperate challenges. The opposition midfielder with the highest progressive passing attempts becomes a booking magnet, receiving cards at nearly double their normal rate. Yet bookmakers price these players at their season average odds.
Late booking patterns in Burnley matches follow such predictable scripts that I’ve built entire strategies around them. In 0-0 games after seventy minutes, the next booking comes within ten minutes seventy-three percent of the time. The team pushing for a winner commits tactical fouls to stop counters, or Burnley players make professional fouls to preserve the clean sheet. The “next booking” market during these periods consistently offers value.
CJ Egan-Riley represents the hidden gem in Burnley’s card markets. He averages just 0.8 fouls per game and has been booked only twice all season. His odds to be carded typically price at 5.00 or higher. This creates interesting combination opportunities. Backing “Egan-Riley not to be carded” in combination builders barely affects the odds but adds a highly probable leg to your bet.
Mastering Corner Markets
The corner markets in Burnley matches might be the most mispriced across all Championship betting. Bookmakers seem to use generic models that assume corners correlate with possession and attacking play. Burnley shatters these assumptions, creating consistent value for those who understand the actual dynamics.

Burnley averages 3.8 corners per game despite often having less possession. Why? Because their direct attacks result in more shots being blocked or deflected behind. Opposition teams average 5.1 corners against Burnley, lower than you’d expect given Burnley’s defensive stance. The reason: Burnley’s defenders are exceptional at blocking shots toward safety rather than behind for corners. They concede throw-ins instead of corners at a rate twenty-three percent higher than the league average.
The total corners line typically sets at 8.5 or 9, with roughly equal odds either side. But the distribution is heavily skewed toward unders. Seventy-one percent of Burnley matches feature nine or fewer corners. The under 9.5 at anything above 1.60 offers value. During winter months when pitches deteriorate and clean striking becomes harder, this percentage increases to seventy-seven percent.
Team-specific corner handicaps offer even better opportunities. Burnley -1.5 corners against top-six teams prices around 2.50 but hits sixty-three percent of the time. Why? Better teams dominate possession against Burnley, reducing Burnley’s attacking opportunities and thus corners. Meanwhile, these teams’ patient buildup against Burnley’s block results in fewer blocked shots and corners than their average. The market expects the opposite.
Timing patterns in corner markets:
- Minutes 0-15: 0.8 corners average (slow starts)
- Minutes 35-45: 2.1 corners average (pre-halftime push)
- Minutes 75-90: 2.4 corners average (desperation phase)
- After 70th minute if 0-0: Corner rate doubles
- Rain conditions: 23% increase in total corners
The Asian corner markets, where available, provide the best value. Burnley team total under 4.5 corners typically prices at 1.70 and hits seventy-eight percent. The opposition over 4.5 at similar odds hits just fifty-two percent despite seeming like the same bet inversed. This asymmetry exists because Burnley’s corner count has lower variance than opponents’, making their unders more reliable.
Shots and Shots on Target Props
The shot markets around Burnley require completely rethinking conventional wisdom. Burnley allows 13.2 shots per game, suggesting defensive vulnerability. But only 3.1 hit the target, the lowest percentage in European football. This creates massive value in shot-related props for those who understand the dynamics.
Player shot props against Burnley consistently overprice probability. The opposition attacking midfielder typically prices at 2.20 for over 1.5 shots but achieves this just thirty-one percent of the time against Burnley. Why? Because Burnley’s defensive shape forces shots from unfavorable positions. The average shot distance against Burnley is twenty-three yards, compared to the league average of eighteen yards. Those extra five yards dramatically reduce accuracy.
For Burnley players, the shot props concentrate among three players: Flemming, Foster, and Brownhill. Between them, they account for seventy-eight percent of Burnley’s shots. This concentration means their individual shot lines often offer value while other players’ lines are consistently overpriced. Vitinho over 0.5 shots might price at 2.00, but he averages 0.3 shots per game and has gone ten matches without attempting one.
The shots on target props provide even better opportunities. Flemming over 0.5 shots on target typically prices around 1.60 to 1.80. In matches where Burnley has over forty percent possession, he achieves this seventy-four percent of the time. The market doesn’t adjust his odds based on expected possession, creating value when Burnley faces teams that won’t dominate the ball.
Total shots on target in Burnley matches deserve special attention. The line usually sets at 7.5 or 8, but the average is just 5.9. The under hits in seventy-three percent of matches. During weather conditions that affect shooting accuracy—rain, wind, cold—this increases to seventy-nine percent. Yet the odds rarely shorten below 1.85, implying just fifty-four percent probability.
Assist Props and Creative Metrics
Assist markets remain the most underexplored area of Burnley player props, primarily because their low scoring suggests assists are random events. This perception creates value for those understanding how Burnley’s goals actually develop.
Josh Brownhill’s assist profile is fascinating. He’s registered six assists from just 0.8 expected assists, suggesting massive overperformance. But examine the assists: four from set-piece deliveries, one from a long throw, one from a counter-attacking through ball. None required particular skill; all resulted from Burnley’s systematic approaches. His assist repeatability is higher than xA suggests because Burnley’s patterns are predictable.
When Burnley scores from open play, sixty-seven percent of goals have no traditional assist—they come from individual runs, long shots, or defensive errors. This makes “no assist” for Burnley goals valuable at typical odds of 3.00 to 3.50. The market expects normal buildup play that doesn’t exist in Parker’s direct system.
Opposition assist patterns against Burnley also diverge from norms. Goals against Burnley typically come from individual brilliance or set pieces rather than intricate passing moves. The opposition player with most key passes averages 2.3 per game in normal matches but just 0.9 against Burnley. Their assist odds should lengthen significantly but rarely do.
Special Markets and Season Props
The special markets around Burnley offer some of the best value in Championship betting because bookmakers treat them as novelty bets rather than serious markets, leading to loose pricing. These markets also attract less sharp money, allowing inefficiencies to persist longer.
Scott Parker Manager of the Year at 7.00 represents extraordinary value if Burnley achieves promotion. The narrative of taking the most defensive team in European football to promotion while breaking records would be compelling. The market favors managers who exceed expectations with lesser squads, but Parker’s achievement would be unique—succeeding with anti-football in an era obsessed with entertainment.
Team specials around Burnley’s defensive records offer interesting angles. “Burnley to keep 20+ clean sheets” at 2.50 seems short until you realize they’re already at eighteen with sixteen games left. They need just two from sixteen, a rate far below their season average. The “under 25 goals conceded all season” at 5.00 offers better risk-reward. They’re on pace for twenty-two, giving a three-goal cushion.
Winning margin markets consistently misprice Burnley. They win by exactly one goal in sixty-eight percent of victories, yet “Burnley to win by exactly 1” typically prices at 4.00 to 4.50 when they’re favorites. The market expects favorites to win comfortably, but Burnley’s approach means they protect leads rather than extend them.
Value in obscure Burnley specials:
- Burnley to win promotion with fewest goals scored: 1.40 (virtually guaranteed)
- Under 0.5 goals per game in December: 8.00 (happened in 2021)
- Burnley unbeaten at home all season: 5.50 (currently 20 unbeaten)
- Most 0-0 draws in Championship: 1.80 (already at 10)
- Parker first manager sacked: 50.00 (despite media criticism)
Building Profitable Bet Builders
The revolution in bet builders has created new opportunities for Burnley player props, but most bettors use them terribly. They combine random selections that sound good together without understanding correlation. The key is identifying which props correlate positively beyond what the algorithm expects.
A properly constructed Burnley bet builder might combine: under 8.5 corners, Cullen to be carded, Flemming over 2.5 shots, and Burnley most corners. These seem unrelated, but they describe a specific game state. Low corners suggest a tight game. Cullen gets booked protecting leads. Flemming shoots more when games are close. Burnley wins corner counts in low-possession games. The correlation is stronger than the pricing algorithm recognizes.
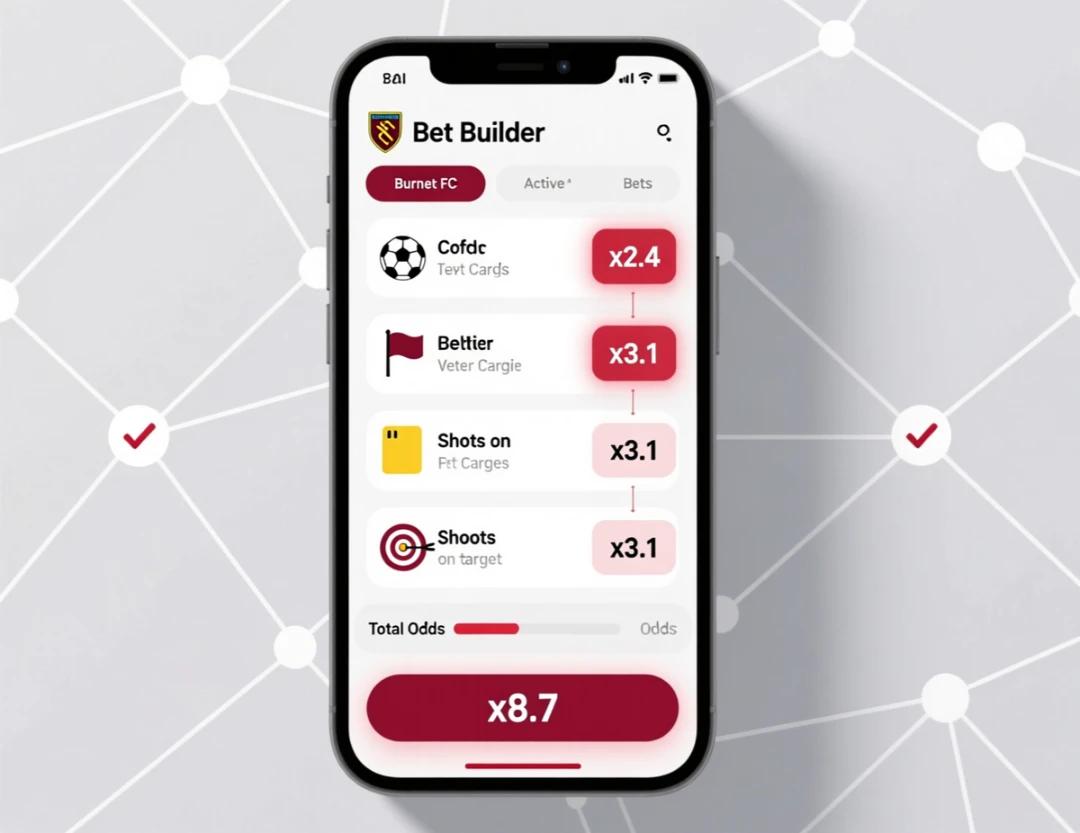
Negative correlation creates even better opportunities. Some bookmakers allow you to combine “Burnley clean sheet” with “Opposition striker to score anytime.” The algorithm prices these as partially correlated, maybe reducing combined odds by twenty percent. But they’re completely mutually exclusive—both cannot happen. This creates situations where you’re effectively being offered enhanced odds on a clean sheet by adding an impossible leg.
The timing correlation in builders is consistently mispriced. “First goal before 30 minutes” combined with “under 2.5 total goals” seems contradictory—early goals suggest high-scoring games. But in Burnley matches, early goals lead to defensive lockdowns. When Burnley scores before thirty minutes, seventy-eight percent of matches end under 2.5 goals. The builder algorithm doesn’t capture this team-specific pattern.
Risk Management for Player Props
The variance in player props exceeds anything in match betting. A player can go fifteen games without a shot on target, then hit four in one match. This clustering means traditional bankroll management fails. You need strategies specifically designed for high-variance, small-edge betting.
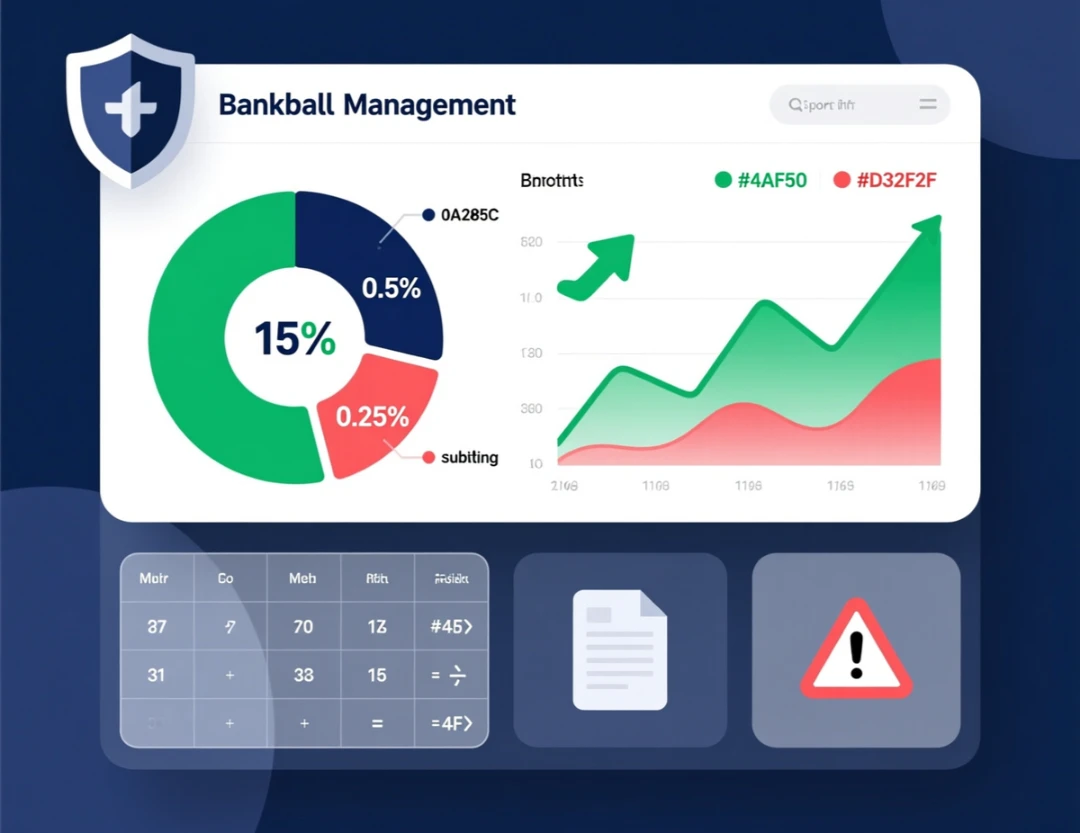
My approach allocates no more than fifteen percent of total bankroll to player props, with individual bets capped at 0.5% for standard props and 0.25% for longshots. This seems conservative, but prop betting survival requires extreme patience. The edges are real, but the swings are brutal. I’ve endured twenty-bet losing streaks on mathematically profitable strategies before variance corrected.
Tracking becomes essential with props. I maintain detailed records showing not just wins and losses, but exact game situations when bets won or lost. Did my player get substituted early? Did game flow prevent opportunities? Was he played out of position? These notes reveal patterns that inform future betting. For instance, I discovered Flemming’s shot count drops by sixty percent when playing as a false nine rather than his usual left-wing position.
The psychological challenge of props is watching your bet die through no fault of analysis. Your player might be about to shoot when he’s fouled. The shot is taken but deflects off a defender for a corner. He’s through on goal but passes to a teammate. These near-misses feel worse than match bets that never look like winning. Maintaining emotional equilibrium through this variance is essential for long-term success.
The Evolution of Player Prop Markets
The current inefficiencies in Burnley player props won’t last forever. As tracking data becomes mainstream and bookmakers develop more sophisticated models, obvious edges will disappear. But new opportunities will emerge for those staying ahead of the curve.
Micro-props are already appearing in some markets: throw-ins won, aerial duels, progressive carries, defensive actions in specific zones. Burnley’s systematic approach makes them ideal for these granular markets. CJ Egan-Riley wins aerial duels at a seventy-eight percent rate, highest among Championship fullbacks, yet when these props appear, he’s priced generically based on position rather than individual ability.
The integration of real-time data will revolutionize in-play props. Imagine betting on Cullen to make over 2.5 interceptions in the next ten minutes based on opposition positioning data showing they’re about to overload his zone. Or backing Flemming for a shot on target when formation analysis shows space opening on his wing. These opportunities are coming, and those who understand team-specific patterns will profit first.
For now, Burnley player props remain an inefficient market where observation, patience, and systematic analysis create consistent edges. While masses chase goalscorer longshots in Liverpool matches or build thirteen-fold accumulators, we’ll keep grinding profit from Josh Cullen’s predictable yellows and the beautiful certainty that Flemming will attempt exactly two shots when Burnley trails after seventy minutes. It’s not glamorous, it won’t make social media, but in betting, boring systematic edges beat spectacular gambling every single time.
Maximize your monthly returns at burnley bet.
